Building an Email Management System for Workload Distribution
How I replaced a slow workflow with a controllable local platform that classifies enquiries, balances staff workload, and keeps operators in control.
- Role
- Architecture and implementation
- Context
- Commercial internal platform
- Core stack
- Python · Flask · React · Electron · SQL
- < 1 sec
- Classification time
- 95%
- Routing baseline
- 2 apps
- Separated architecture
Reduced from an end-to-end maximum of 15 minutes
Configurable and supported by manual review
Background processor and operator dashboard
On this page
Hundreds of enquiries arrived through a shared inbox each day, but one person was responsible for reading and distributing them. That created a single point of failure: work accumulated during absences, distribution was difficult to audit, and the person assigning enquiries was also completing some of them.
The project evolved through two phases. The first was a collaborative Power Automate prototype that proved the idea but exposed serious performance and scaling constraints. The second was an independently designed local platform built around Python, Flask, React, Electron, SQLite, SQL Server, and Microsoft Graph.
The operational problem#
The original process had four connected problems:
- Coverage gaps: emails waited when the person responsible for distribution was unavailable.
- Backlog pressure: returning to a full inbox created avoidable workload spikes.
- Uneven distribution: assigning work manually made it difficult to account consistently for availability, territory, product knowledge, and existing workload.
- Limited transparency: staff could not easily see why an enquiry had been assigned to a particular person.
The goal was not simply to forward emails faster. The system needed to make a defensible routing decision, expose the reasoning to an operator, and remain adjustable as products, territories, and staffing changed.
Phase 1: proving the concept#
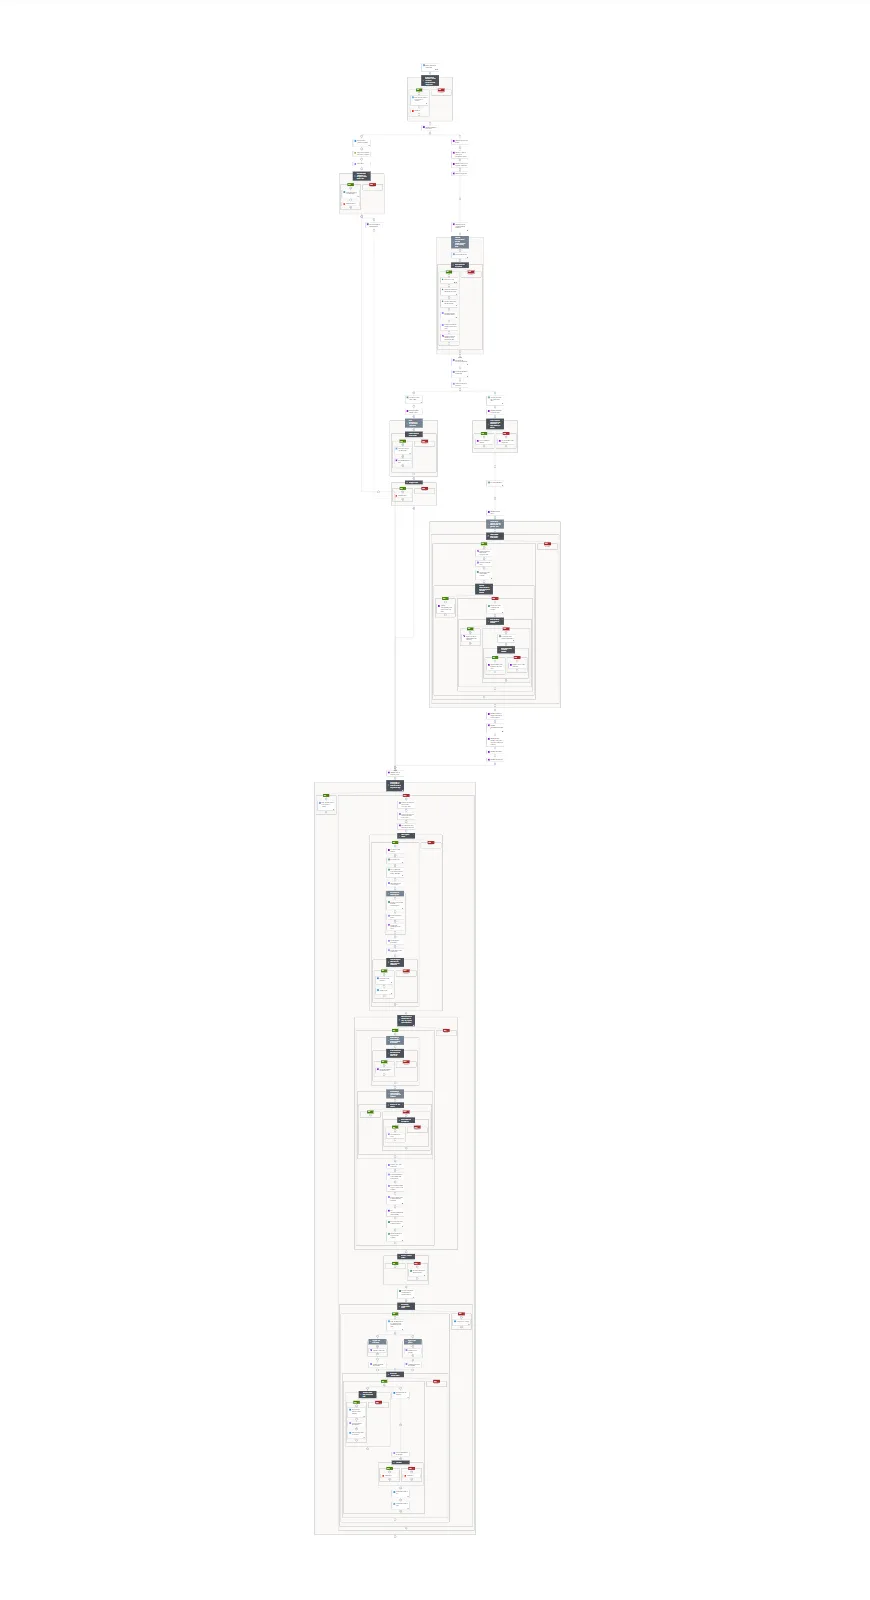
The first implementation was developed collaboratively with a software team using Microsoft Power Automate. The workflow extracted information from incoming messages, looked up reference data in an online spreadsheet, selected a member of staff, forwarded the enquiry, and prepared an acknowledgement.
My main contribution was the Python geographic-classification function and its integration with the workflow. It analysed several independent signals:
- place names found in the message body;
- international telephone numbers;
- postcodes in different national formats; and
- IP addresses extracted from email headers.
The signals were weighted rather than treated as equally reliable. This helped resolve ambiguous locations and allowed multiple weak indicators to contribute to a stronger result.
What the prototype revealed#
The Python analysis itself averaged roughly 0.3 seconds, but the surrounding Power Automate workflow could take up to 15 minutes per email. Adding product lines and search terms also made the workflow more brittle and difficult to tune.
| Measure | Phase 1 result | What it meant |
|---|---|---|
| Python geographic analysis | Around 0.3 seconds | The core classification logic was fast |
| End-to-end processing | Up to 15 minutes | External workflow latency removed the benefit |
| Assignment accuracy | Below 1% in the recorded baseline | The complete routing process was not dependable |
| Extensibility | Poor | More products and rules increased complexity |
The prototype was useful because it made the architectural constraint visible. Improving the Python function alone could not solve latency and maintainability elsewhere in the workflow. The requirements had also grown beyond the original scope, so continuing to patch the first design would have created more rework.
Design goals for the rebuild#
The second phase was designed around explicit operational requirements:
- Process messages without third-party workflow latency or throttling.
- Make classification rules configurable and testable outside production.
- Integrate directly with Microsoft 365 through Microsoft Graph and OAuth2.
- Keep the processor isolated from the management interface.
- Support manual review, confidence ratings, and safe automatic operation.
- Persist state locally while reading CRM and workload context from existing systems.
- Surface health, logs, settings, and failures clearly to operators.
- Package the solution for reliable use on Windows with minimal setup.
Architecture#
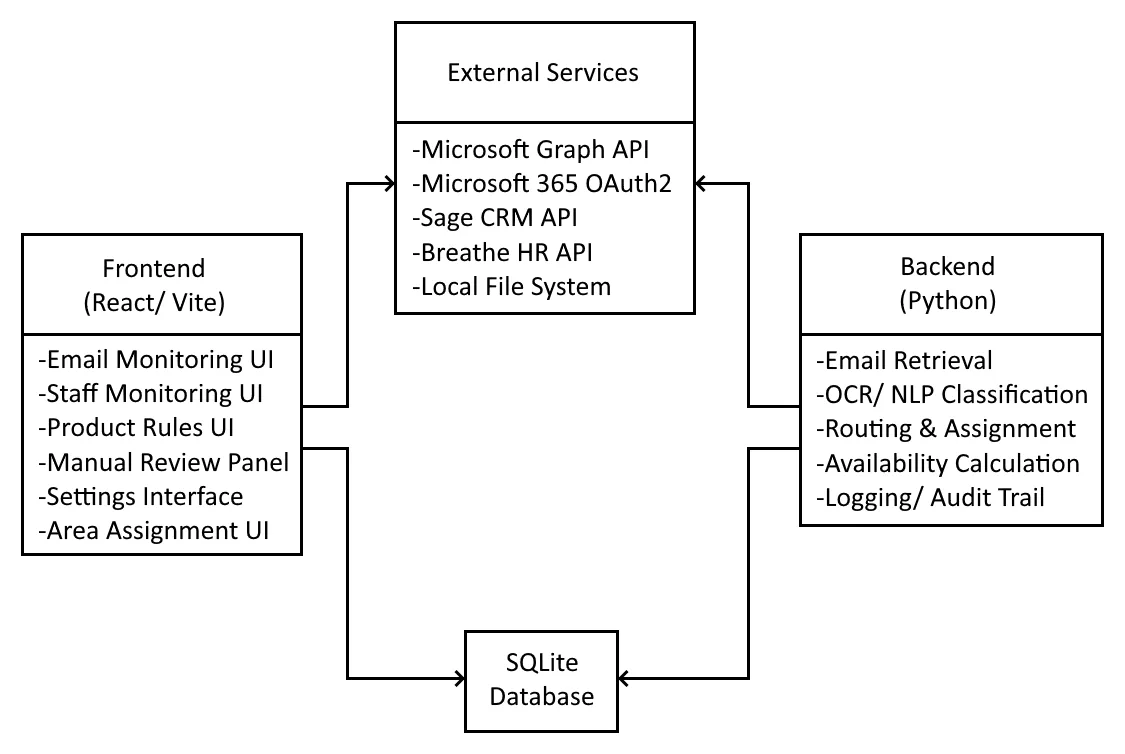
The finished design consists of two cooperating local applications with clearly separated responsibilities.
Email processing service#
A Python application runs as a background Windows service. A coordinator manages configuration, reference datasets, scheduling, and logging, while a separate worker processes messages. The service:
- retrieves email directly through Microsoft Graph;
- converts HTML messages into normalised text;
- extracts geographic and product signals;
- resolves reference data through SQLite and SQL Server;
- calculates routing candidates and confidence;
- persists processing state; and
- exposes a small Flask control API for health and operational commands.
Management dashboard#
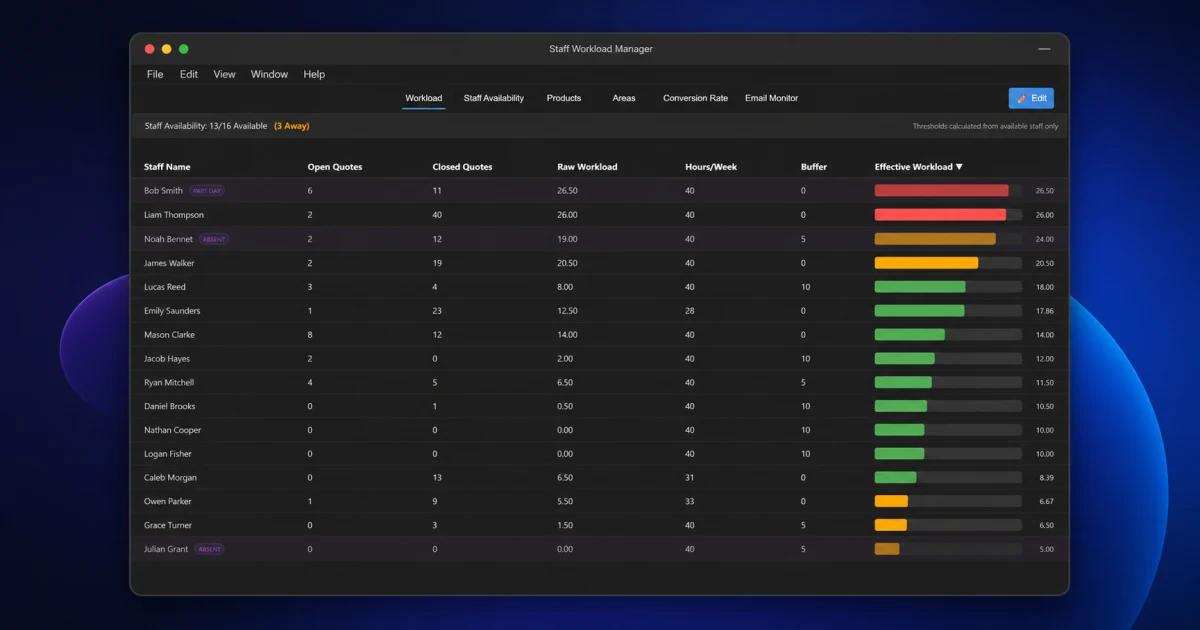
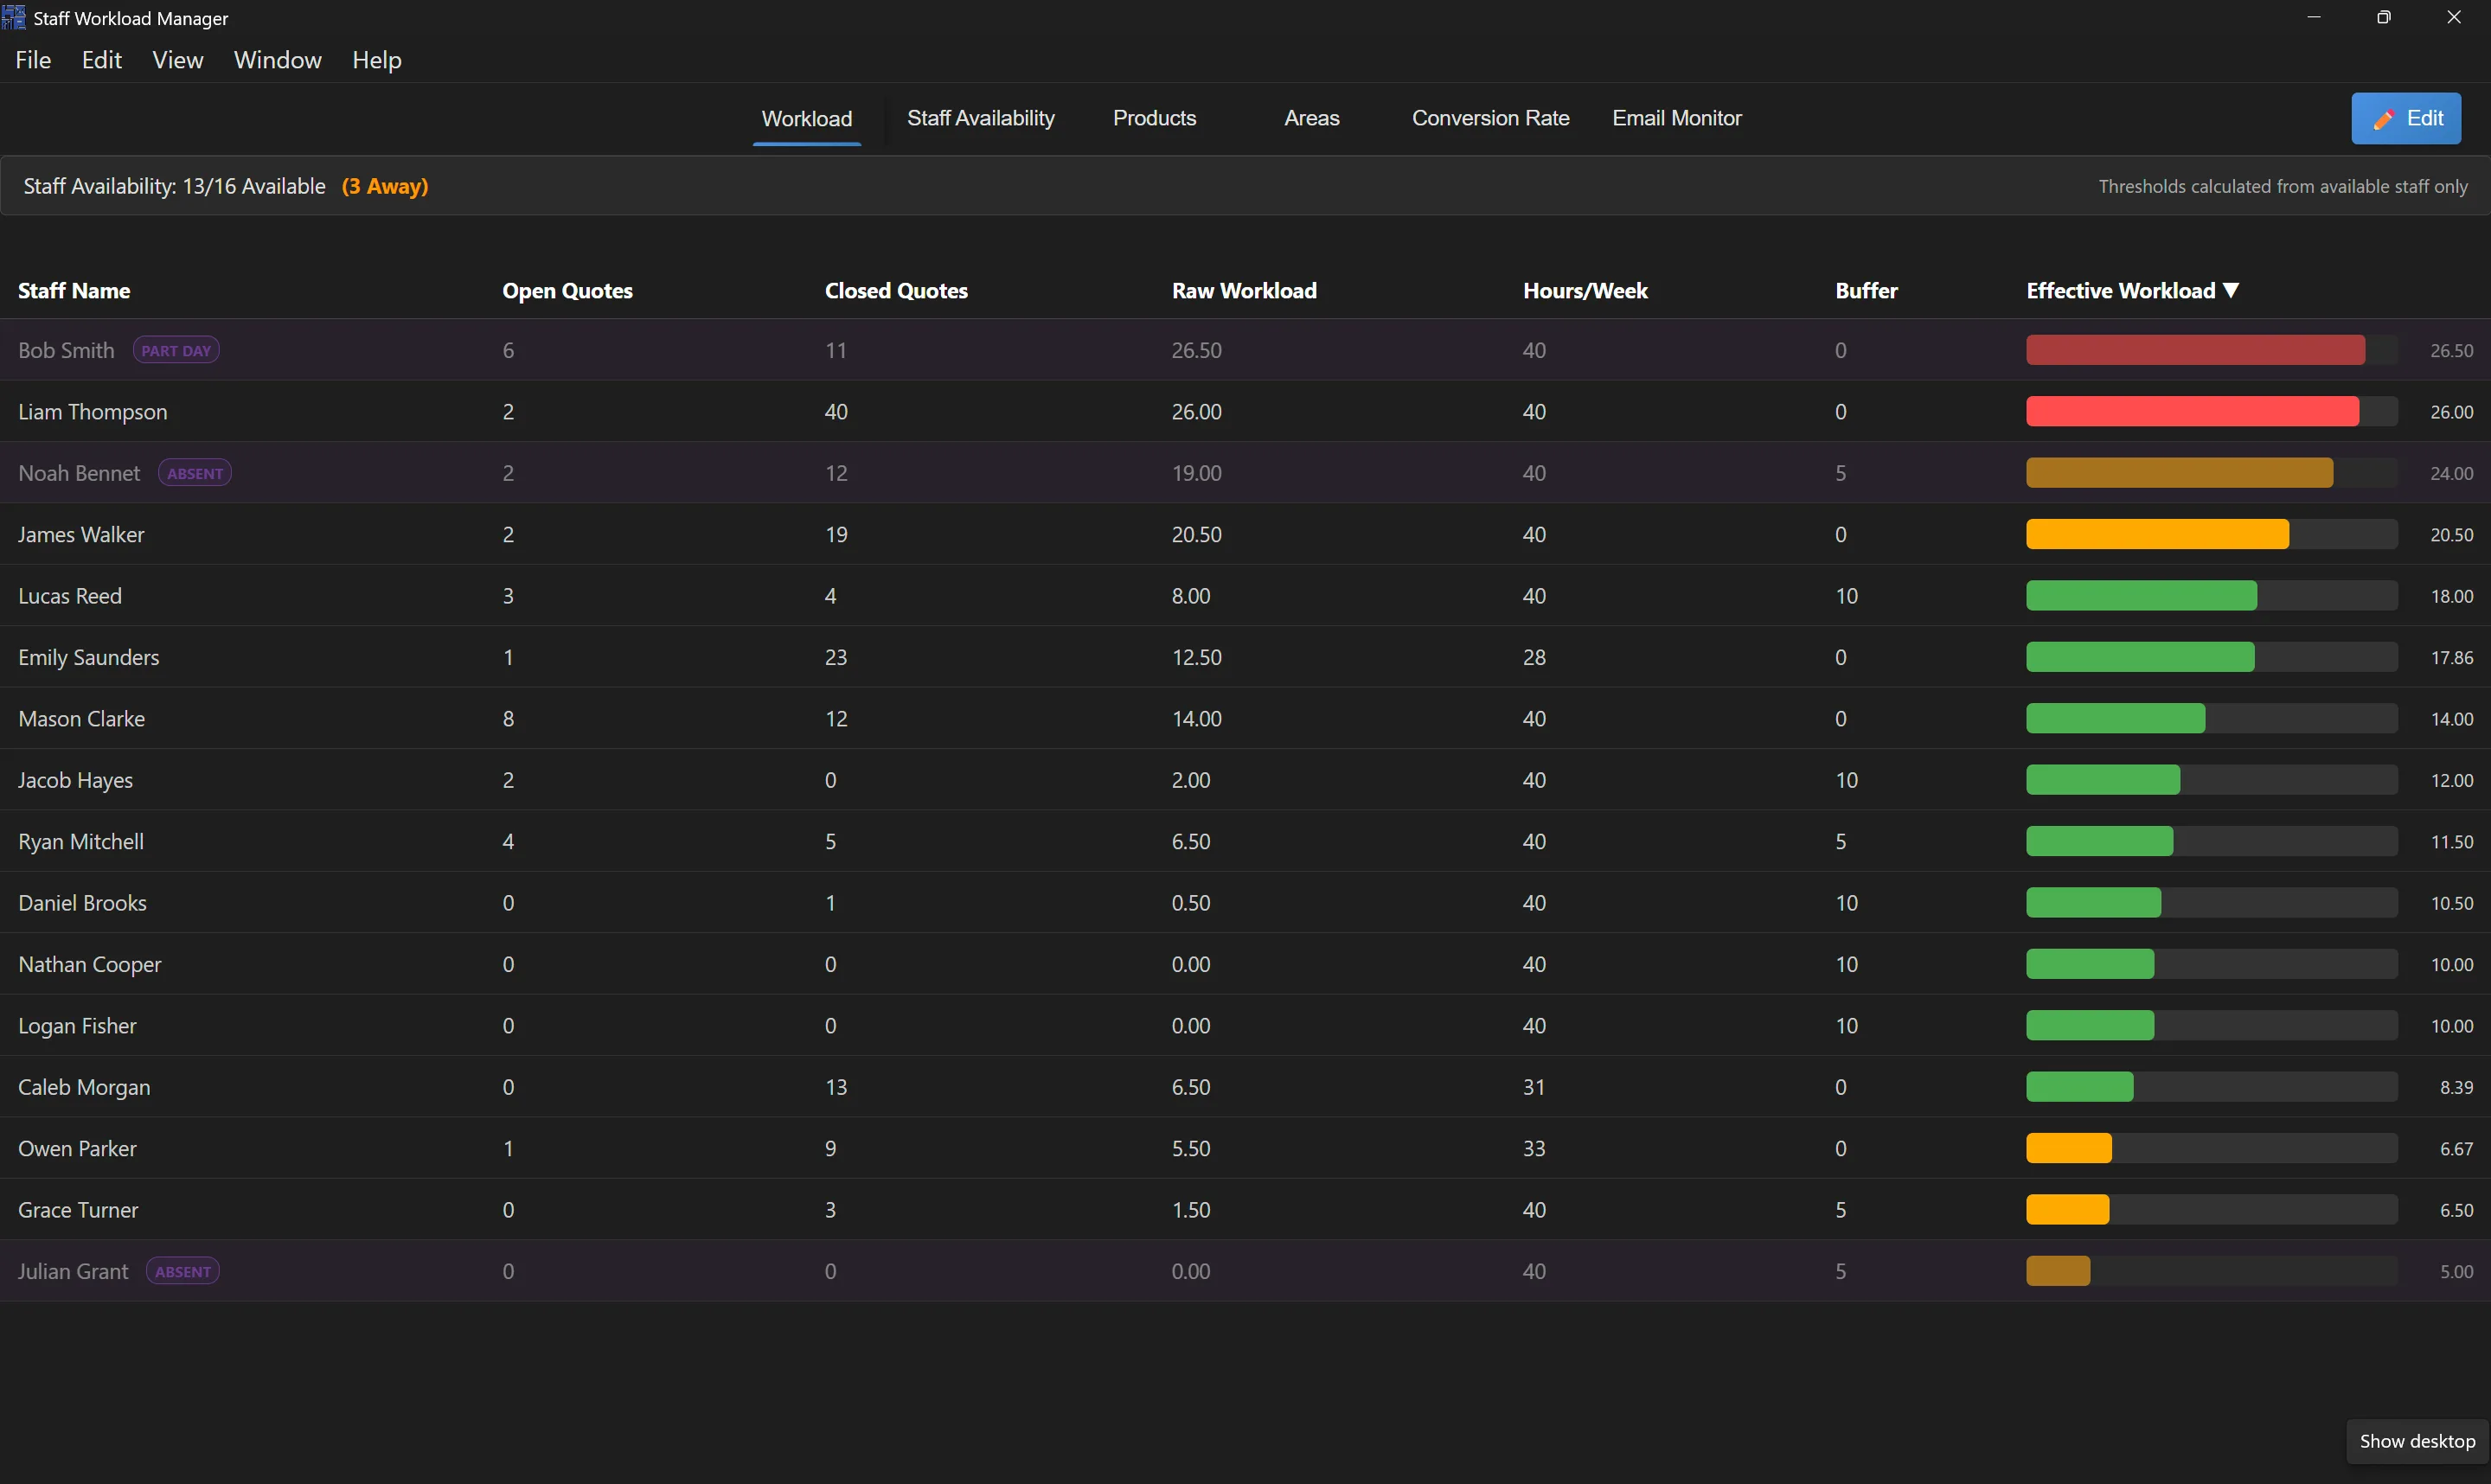
A React application communicates with a Flask backend and is packaged with Electron. It gives operators visibility into:
- effective staff workload and capacity;
- attendance and availability;
- territories and geographic boundaries;
- product ownership and routing settings;
- conversion data;
- live email processing; and
- automatic, manual, and review workflows.
The separation means the processor can continue performing its core job without depending on the desktop interface. It also limits the responsibility of each component and makes failures easier to diagnose.
Local operator machine
├── Management application
│   ├── React + Vite interface
│   ├── Electron desktop shell
│   └── Flask REST API
│
├── Shared operational data
│   ├── SQLite state and reference datasets
│   └── SQL Server CRM and workload context
│
└── Email processing service
    ├── Microsoft Graph + OAuth2
    ├── Parsing and classification pipeline
    ├── Routing and confidence rules
    └── Flask control API
Classification and routing pipeline#
Each message moves through a staged pipeline:
- Retrieve: Microsoft Graph supplies the message and headers.
- Normalise: HTML is converted into clean text suitable for analysis.
- Extract: the processor identifies postcodes, place names, telephone numbers, IP addresses, and product codes.
- Resolve: SQLite reference data, GeoNames, and SQL Server context are used to disambiguate the extracted signals.
- Score: weighted evidence produces geographic, product, and routing candidates with confidence values.
- Balance: availability, contracted hours, open workload, territory, product knowledge, and external responsibilities influence the final assignment.
- Act or review: the result can be executed automatically or presented to an operator for confirmation.
- Persist: the decision, state, and operational information are recorded for the dashboard.
This staged approach was important because it made individual decisions inspectable. A failure in product detection could be diagnosed separately from geographic classification or workload balancing.
Integrations and data ownership#
| Integration | Purpose | Failure behaviour |
|---|---|---|
| Microsoft Graph | Secure email retrieval and management | Processing pauses safely when email access is unavailable |
| SQLite | Local state, settings, and reference datasets | Core local dependency with schema-managed storage |
| SQL Server / CRM | Customer, product, sales, and workload context | Existing local data remains available where possible |
| HR and attendance systems | Current staff availability | Last known state and operator controls prevent blind assignment |
| GeoNames | Geographic disambiguation | Local reference data supports repeatable lookups |
The system does not treat every dependency as equally critical. Email retrieval must be available for processing to continue, whereas some contextual integrations can degrade gracefully or be reviewed manually.
Operator control and trust#
Automation was useful only if staff could understand and control it. The dashboard therefore exposes confidence ratings, health information, live processing state, and the data used to balance work.
Automatic and manual modes serve different operational needs:
- Manual review is useful while rules are being tuned or when confidence is low.
- Automatic mode handles high-confidence decisions without creating a new bottleneck.
- Operational controls allow processing to be paused, resumed, or adjusted without modifying code.
This design keeps people in the decision loop where uncertainty matters while avoiding unnecessary intervention for routine messages.
Reliability, performance, and security#
Reliability and performance#
- Email classification runs independently from the UI.
- Differential settings updates avoid unnecessary writes.
- Workload calculations refresh only when relevant inputs change.
- Backend aggregation reduces repeated database calls.
- Empty states and error handling keep the dashboard usable when contextual data is temporarily unavailable.
Security#
- Microsoft Graph uses OAuth2 rather than credentials embedded in source code.
- Tokens are stored outside the application source and can be revoked.
- The processor is isolated from the desktop interface.
- Role-based dashboard access limits administrative actions.
- Errors are handled without exposing unnecessary message or system data.
Security was part of the architecture rather than a final packaging step. Separating the processor, APIs, and interface reduced the amount of the system that any single failure could affect.
Results and impact#
- Up to 15 minutes per email
- Below 1% recorded routing baseline
- Rules became brittle as scope grew
- Limited operational visibility
- Under one second per email
- 95% routing-accuracy baseline
- Configurable rules and product growth
- Monitoring, confidence, and manual control
The largest improvement was not speed in isolation. The rebuild made performance, accuracy, and operational control improve together. New rules and integrations could be added without reconstructing a visual workflow, and operators gained a clearer view of how work was being distributed.
Lessons learned#
Architecture must follow the real requirement#
The first solution was reasonable for the smaller problem originally described. It became unsuitable when routing logic, integrations, workload balancing, and auditability expanded. Validating the whole operational requirement earlier would have reduced rework.
Fast components do not guarantee a fast system#
A 0.3-second classification function offered little value inside a workflow that took up to 15 minutes end to end. Measuring the complete path exposed the correct bottleneck.
Trust requires visibility and control#
For consequential automation, an accurate result is not enough. Operators need confidence, reasoning, health information, and a safe way to intervene.
Integration failures need explicit behaviour#
“Failure tolerant” does not mean pretending every dependency is optional. Critical services should pause safely; contextual services should degrade predictably; both states should be visible.
What I would improve next#
The platform provides a strong base for further work:
- build a formal labelled evaluation dataset for regression testing;
- version routing rules and compare performance between releases;
- add more granular audit views for individual decisions;
- expand automated integration and failure-recovery tests; and
- use operational feedback to tune confidence thresholds by product category.
Conclusion#
This project changed from an email-forwarding workflow into an operational decision system. Rebuilding it as a modular local platform removed the main latency bottleneck, improved the routing baseline, and gave staff the visibility and control needed to trust the automation.
The central lesson was simple: when requirements include complex rules, sensitive integrations, and human oversight, choosing the right system boundary matters more than continuing to optimise an architecture that no longer fits.