Building a Real-Time Smart Insole App with Bluetooth LE
How I connected pressure-sensing insole hardware to a mobile interface for live pressure maps, session metrics, and clearer BLE device feedback.
- Type
- Connected mobile prototype
- Communication
- Bluetooth Low Energy
- Focus
- Live foot metrics
- BLE
- Device connection
- Live
- Pressure view
- Mobile
- Session interface
Links the insole and mobile app
Preserves spatial foot context
Monitoring, analytics, and settings
On this page
Wearable sensor projects are not complete when data reaches a phone. The application still has to make connection state, changing pressure, and session information understandable to the person using it.
I built this prototype around a pressure-sensing insole connected to a mobile application using Bluetooth Low Energy (BLE). The interface brings live pressure information, session metrics, analytics, and device settings into one product experience.
The project goal#
The insole creates measurements at the foot, but raw sensor values are difficult to interpret on their own. The mobile app was designed to turn that stream into information a user can scan while walking or reviewing a session.
The prototype combines four areas:
- pressure-sensing insole hardware;
- Bluetooth Low Energy communication;
- a mobile interface for connection and live feedback; and
- a data model for presenting foot and session metrics.
This makes it a connected-product project rather than just a mobile screen or a hardware experiment.
End-to-end data flow#
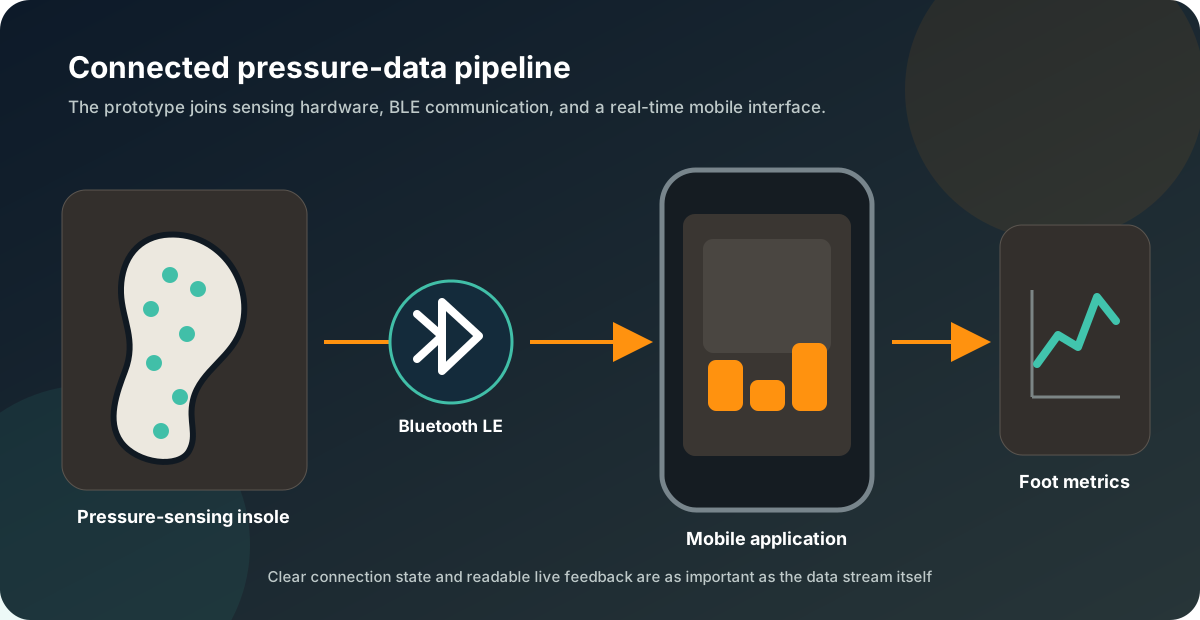
Each part of the pipeline changes the shape or meaning of the data before it reaches the user.
| Stage | Input | Application responsibility |
|---|---|---|
| Insole | Physical pressure across sensing areas | Produce readings that retain their sensor position |
| BLE transport | Wireless data packets | Connect, receive, and detect interruptions |
| Reading model | Incoming sensor values | Associate values with the correct area and session |
| Live interface | Current model state | Present pressure and connection feedback clearly |
| Analytics views | Recorded session information | Organise patterns so they can be reviewed over time |
The important point is that the interface does not receive "a foot metric" directly. It receives a stream that must remain correctly ordered, associated, and timed before a meaningful visual can be shown.
Designing the mobile interface#
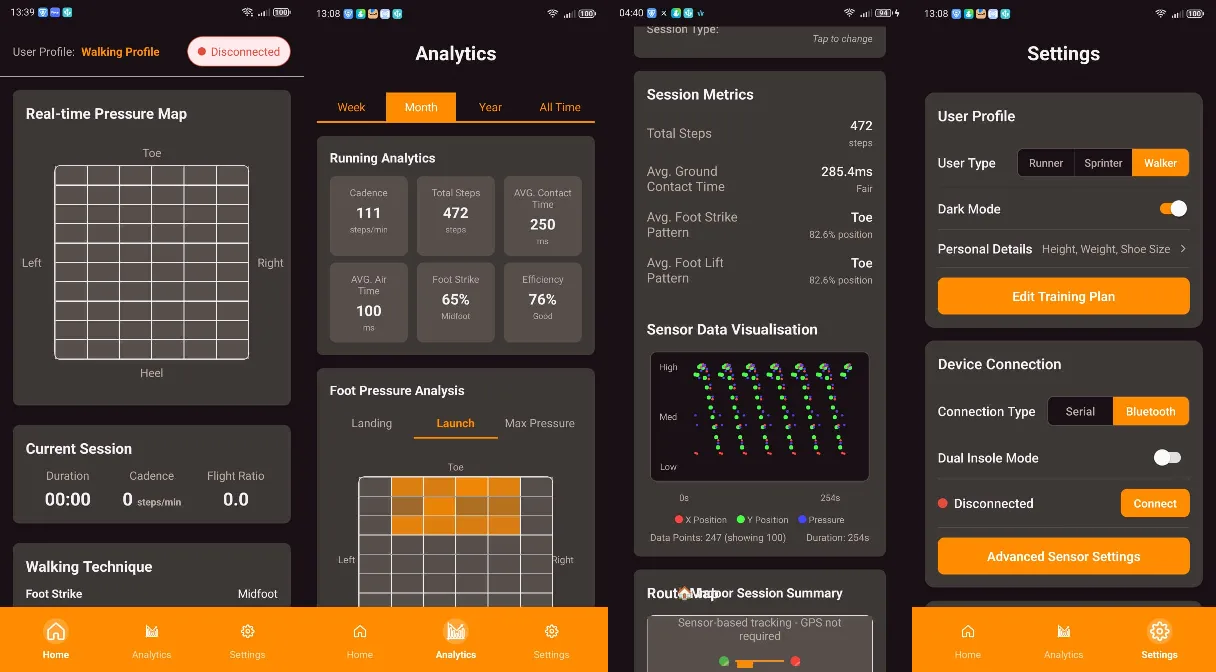
The interface is organised into three main areas:
- Home: current connection, a real-time pressure map, and current-session information.
- Analytics: summaries and visual breakdowns for reviewing foot and session metrics.
- Settings: user profile options, connection type, device controls, and sensor settings.
The home screen prioritises the status that matters during use: whether the insole is connected and whether data is arriving. Analytics can contain more detail because it is reviewed deliberately rather than glanced at during a live session.
Representing foot pressure#
A spatial grid is more useful than a list of sensor values because it preserves the relationship between each reading and the foot. Labels for toe, heel, left, and right provide orientation, while colour or intensity can communicate relative pressure.
There are several design risks:
- an empty grid can mean no pressure, no data, or no device;
- a colour scale can appear precise even when sensors are not calibrated;
- rapidly changing cells can become visually noisy;
- different users or shoe fits may produce different baselines; and
- smoothing the display too heavily can hide real changes.
The UI therefore needs connection and session context around the visualisation. A heat map alone cannot explain whether its source is healthy.
Managing Bluetooth Low Energy state#
BLE is well suited to a wearable prototype because it supports short-range communication with relatively low power use. From the application perspective, however, it introduces a lifecycle rather than a single "connected" flag.
| State | What the user needs to understand |
|---|---|
| Disconnected | No live readings are expected |
| Searching | The application is looking for an available device |
| Connecting | A device has been selected but the stream is not ready |
| Connected | Live readings can be received |
| Interrupted | The previous stream is no longer current |
These labels describe the interface states a robust implementation should distinguish; exact device behaviour depends on the insole hardware and BLE protocol.
Clear state handling prevents stale values from being mistaken for current measurements. It also gives the interface a useful response when the device moves out of range or the phone changes connectivity state.
Structuring live and session data#
The app needs two related views of the same system:
- Live state answers what is happening now.
- Session state provides enough structure to review what happened over a period.
Keeping those ideas separate avoids rebuilding the entire history every time one sensor changes. It also makes it possible to clear or start a session without losing device configuration.
A practical model for this type of app needs to preserve:
- which sensor or area produced a value;
- when the reading was received;
- which active session it belongs to;
- the current connection and stream status; and
- any transformation used to turn a raw value into a displayed metric.
The final field is particularly important. If calibration or normalisation changes, the displayed result should remain traceable to the method that produced it.
Real-time UI performance#
Sensor streams can update more often than the whole screen needs to render. Updating every component for every packet would waste battery and can make animations or navigation feel unstable.
The interface should therefore:
- update only the visual elements affected by a new reading;
- separate transport state from presentation state;
- limit visual refreshes where a faster rate would not be perceptible;
- avoid performing historical analysis on the main render path; and
- show when the most recent reading is no longer fresh.
These decisions make the application feel more reliable even before any complex analytics are added.
Validation and limitations#
The screenshots demonstrate the product direction and interface structure, but the quality of any derived metric depends on the hardware and its validation. Before treating outputs as dependable measurements, I would test:
- sensor repeatability under the same applied load;
- variation between users, shoes, and insole placement;
- packet loss and reconnect behaviour;
- the delay between a pressure change and the displayed response;
- battery behaviour during longer sessions; and
- whether users interpret the pressure visualisation consistently.
The app should also avoid presenting prototype calculations as medical assessment. Clear scope is especially important for wearable and health-adjacent technology.
What I would improve next#
The next iteration would benefit from more documented hardware evidence and a tighter evaluation loop:
- record the exact sensor layout and BLE message format;
- add explicit stale-data and reconnect states;
- compare raw and calibrated readings during repeatable tests;
- define a versioned session export for offline analysis;
- test the live pressure view on different screen sizes; and
- validate which metrics are genuinely useful rather than merely available.
Lessons learned#
Connection state is part of the data#
The same numeric value means something different when it is live, delayed, simulated, or disconnected. Transport state has to remain visible to the rest of the application.
Spatial sensors need spatial presentation#
Preserving toe, heel, left, and right context makes a pressure grid much easier to interpret than a sequence of anonymous channels.
A prototype should expose uncertainty#
Polished visualisations can make early measurements appear more authoritative than they are. Calibration state, missing data, and prototype limitations should be communicated explicitly.
Conclusion#
The smart insole app connects physical pressure sensing, BLE communication, live mobile feedback, and session-oriented views. Its main engineering lesson is that a reliable connected interface must explain not only the measurement, but also where it came from and whether it is still current.